The automobile manufacturer Škoda Auto needed a simple web application for its top management which could work with a large amount of data yet would be user-friendly and easy to read. Application Škoda Moped allows managers to view current data for all countries every day and on any device, compare and track other interesting data in well-arranged charts and spreadsheets.


Framework with D3.js technology

The four-member team spent a single month on development

Large volume of data in well-arranged and interactive charts
The most important parts of the entire application are charts and graphs. Škoda Auto had definite requirements for what they should show and how they should look like. At the beginning, we carefully examined the possibilities of chosen frameworks (Raphaël.js, Highchart.js or D3.js) before the winning and then testing of D3.js.
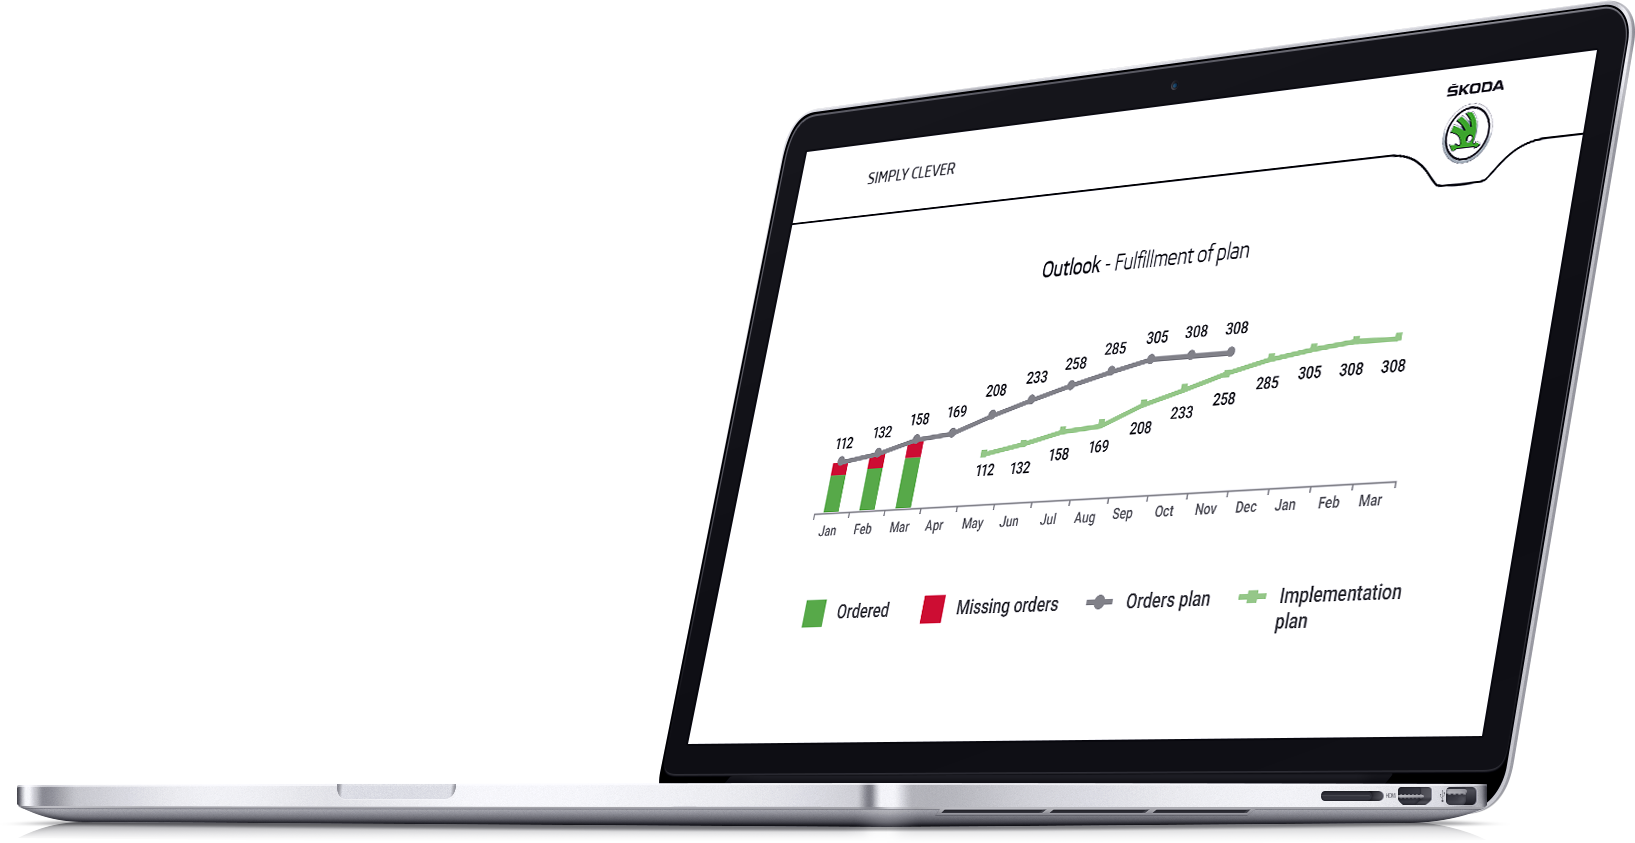
Both graphics and project analysis were already prepared. We were there to handle only the technical analysis and design the web application. D3.js technology allowed us a great deal of freedom in charting, although one problem appeared. Limit values. The chart did not look good – sometimes the values were so small the labels did not appear anymore. Solving this problem meant extra work for us, however we are very satisfied with the result now.
Everything was proceeded quickly and smoothly as we had the support of the library D3.js. Other used technologies included React, Javascript, SVG and PHP. We put great emphasis on testing to deliver outputs to our client often with minimal amount of software bugs. Our goal was to meet the high standards that Škoda Auto is accustomed to.
Both sides were satisfied. Thanks to that our collaboration continues and Škoda Auto already wants us to implement other possible application features.
Škoda Moped is a part of the new Customer satisfaction module of the complex internal project of Škoda Auto. It is a system that contains a large number of interactive graphs to compare large volumes of market data and country trends.