
Try to Google a bit and find some blog posts about adoption of microservices, Docker, Kubernetes and other “new” stuff in the traditional environments. Almost every post is like "yeah, microservices are kinda cool, but monitoring and overall observability is very challenging."
Well, that's not true anymore. And today I’m gonna show you one important pillar of this shift from "challenging" to "absolutely possible." Please make some noise for the technology which can't be missing in your microservice stack - distributed tracing.
From dumb logs to something meaningful
Do you remember your first computer programs? Unfortunately, I do remember mine. I can remember one particular program which was basically a web crawler searching for mp3 files. It was a disaster, but I remember thousands lines of logs which were showing elapsed time at the certain tasks.
At that time I did not know tracing, but basically that's the idea - you want to point your finger at the certain time frame and see what was your program doing (with the absolute precision!).
But distributed tracing is not as dumb as my logs, distributed tracing is special, beautiful. ❤️
Market status
You’d be surprised, but market is full of tracing solutions. There's Zipkin founded by Twitter, OpenCensus pushed by Google and Microsoft and there’s also a few tools compatible with Opentracing specification. There are also some tools integrated to the public cloud environments such as Stackdriver Trace (Google Cloud Platform) or AWS X-Ray. This is not a complete list, but I don't want to waste the last pieces of youth on googling. Just kidding, it has already happened so I'm just a lazy bastard.
Opentracing compatible tools are particularly interesting since they are interchangeable, i.e. if you’re not happy with paid Datadog - you can just change few lines of code and switch to self-hosted Jaeger. All the tracing instrumentation inside your application logic will remain the same. Based on my research, the most popular tracing solution is Uber’s Jaeger (part of CNCF), hence I’m gonna show you how to build simple Node.js app with Jaeger tracing enabled.
Also, everything from CNCF is kinda cool and I really want to test all these tools. ?
Leap 1: Jaeger infrastructure
Jaeger itself is built with microservice design in mind, which means there’s no monolithic giant super-application which handles all the stuff. Instead, we have to spin up jaeger-collector (receives and processes traces from Jaeger agents), jaeger-query (retrieves traces from the storage backend and displays them in the UI) and jaeger-agent (receives spans from the application).
As this is just educational demo, I’m gonna create a new Elasticsearch instance in the Elastic cloud (Jaeger support Cassandra and Elasticsearch as persistent storage backends) so I don’t have to spend extra time configuring my own Elasticsearch. ?
Then we just need to write a few lines in docker compose file.
version: '3.7'
services:

  agent:
    image: jaegertracing/jaeger-agent:1.10
    command: ["--reporter.tchannel.host-port=collector:14267"]

  collector:
    image: jaegertracing/jaeger-collector:1.10
    environment:
      SPAN_STORAGE_TYPE: elasticsearch
      ES_SERVER_URLS: "${ES_SERVER_URLS}"
      ES_PASSWORD: "${ES_PASSWORD}"
      ES_USERNAME: "${ES_USERNAME}"

  query:
    image: jaegertracing/jaeger-query:1.10
    environment:
      SPAN_STORAGE_TYPE: elasticsearch
      ES_SERVER_URLS: "${ES_SERVER_URLS}"
      ES_PASSWORD: "${ES_PASSWORD}"
      ES_USERNAME: "${ES_USERNAME}"
    ports:
      - 8080:16686 # we will use 8080 to access UI
Easy, isn't it?
Leap 2: Microservices
Disclaimer: My Javascript code can make you want to cry. I'm sorry in advance. ?
As I’ve already mentioned, tracers implementing Opentracing standard are interchangeable so it’s probably a good idea to put them to separate unit and treat them like some external modules. This is content of file tracer.js, pretty straightforward.
const initTracerFromEnv = require('jaeger-client').initTracerFromEnv;
module.exports = initTracerFromEnv({}, {
  logger: console,
  tags: {
    'project.name': process.env.APP_PROJECT_NAME,
  }
});
The next important part is the main application code with the specification of Express handlers. Please note the tracingMiddleware there, I'm gonna explain it right away.
const tracer = require('./tracer');
const express = require('express');
const rp = require('request-promise');
const tracingMiddleware = require('./tracing-middleware');
const { Tags, FORMAT_HTTP_HEADERS } = require('opentracing');

const app = express();
app.use(tracingMiddleware);

app.get('/service1', function(req, res) {

  const uri = 'http://service2:3000/service2';
  const headers = {};
  tracer.inject(req.span, FORMAT_HTTP_HEADERS, headers);

  rp({ uri, headers })
    .then(function(result) {
      res.send(result)
    })
    .catch(function(err) {
      res.status(500).send("It's broken");
    });

});

app.get('/service2', function(req, res) {
  res.send(`Hola, I'm ${process.env.JAEGER_SERVICE_NAME}`)
});

app.listen(process.env.APP_PORT, function() {
  console.log(`Example app listening on port ${process.env.APP_PORT}!`);
});
Now let’s go through some interesting parts - the first interesting part is obviously tracingMiddleware. It’s basically just common Express middleware which scans incoming HTTP requests for headers with the existing trace context.
const tracer = require('./tracer');
const { Tags, FORMAT_HTTP_HEADERS } = require('opentracing');

module.exports = function(req, res, next) {
  // set parent context if needed
  const parentSpanContext = tracer.extract(FORMAT_HTTP_HEADERS, req.headers);
  req.span = tracer.startSpan(`${req.method}: ${req.path}`, {
    childOf: parentSpanContext,
  });

  res.on('finish', function() {
    req.span.setTag(Tags.HTTP_STATUS_CODE, res.statusCode);
    // check HTTP status code
    req.span.setTag(Tags.ERROR, ((res.statusCode >= 500 ) ? true : false));
    // close the span
    req.span.finish();
  });

  next();
}
If there’s no existing trace context - it just creates a new root span. Please note it also modifies the request object so span object will be accessible during the further processing. Now let's get back to the main code.
The next interesting part is the tracer.inject directive.
tracer.inject(req.span, FORMAT_HTTP_HEADERS, headers);As you can guess, it does not do anything special, it only injects a few properties to the arbitrary object, in this case it’s empty object since we don’t need additional headers. Why do we need to have these special headers injected to the object with headers? Because this is how we ensure the context propagation between microservices.
Do you remember the part with Express middleware? When middleware receives certain HTTP headers, it automatically creates a new trace span with childOf property configured. So that’s why we need to inject headers in the “client” part of our application.
Now we need to append a few lines to the Docker compose file and give it a try.
  service1:
    build:
      context: ./service
    environment:
      JAEGER_SERVICE_NAME: "service1"
      JAEGER_AGENT_HOST: "agent"
      JAEGER_AGENT_PORT: "6832"
      JAEGER_REPORTER_LOG_SPANS: "true"
      JAEGER_SAMPLER_TYPE: "probabilistic"
      JAEGER_SAMPLER_PARAM: "1.0"
      APP_PORT: 3000
      APP_PROJECT_NAME: project001
    ports:
      - 3001:3000

  service2:
    build:
      context: ./service
    environment:
      JAEGER_SERVICE_NAME: "service2"
      JAEGER_AGENT_HOST: "agent"
      JAEGER_AGENT_PORT: "6832"
      JAEGER_REPORTER_LOG_SPANS: "true"
      JAEGER_SAMPLER_TYPE: "probabilistic"
      JAEGER_SAMPLER_PARAM: "1.0"
      APP_PORT: 3000
      APP_PROJECT_NAME: project001
    ports:
      - 3002:3000
Show time
This is the time we were waiting for. Let me just summarize our expectations:
- we want to call http://localhost:3001/service1
- we want to see nested spans (under span from the service1) from the service2
As we’ve built our testing solution on top of Docker compose, we just need to build Docker image with docker-compose build and then start the whole stack with docker-compose up.
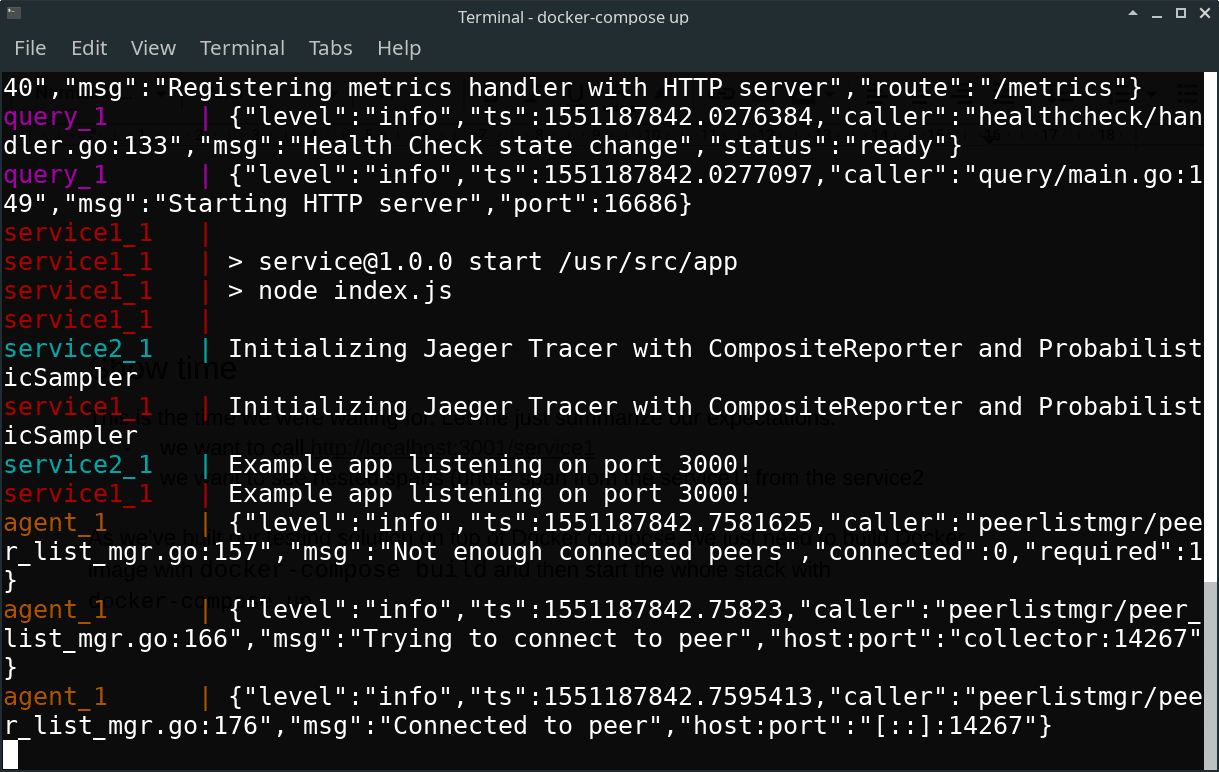
Now we should be able to send a few requests to the first service.
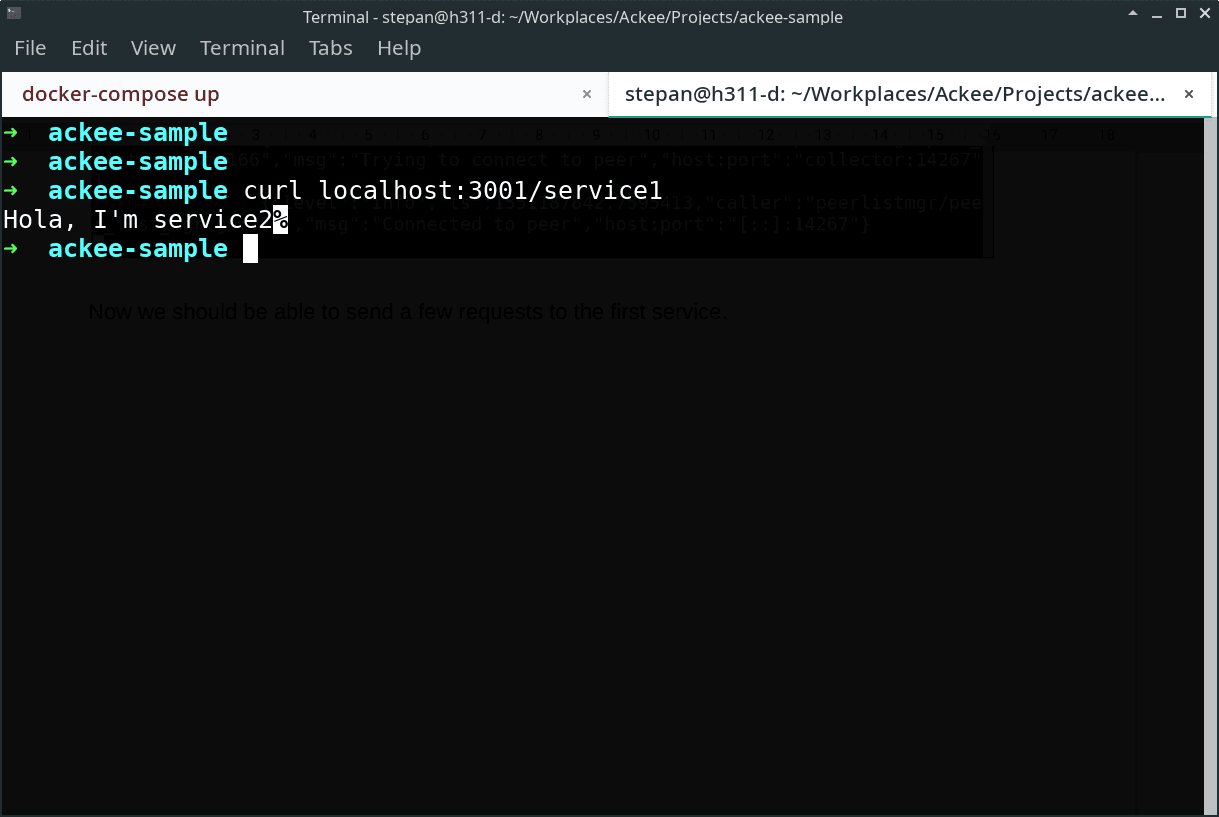
Great! Our web services did not crash (and to be honest, I’m always a bit surprised when things work as expected) so now we just need to check Jaeger UI and see the recorded spans.
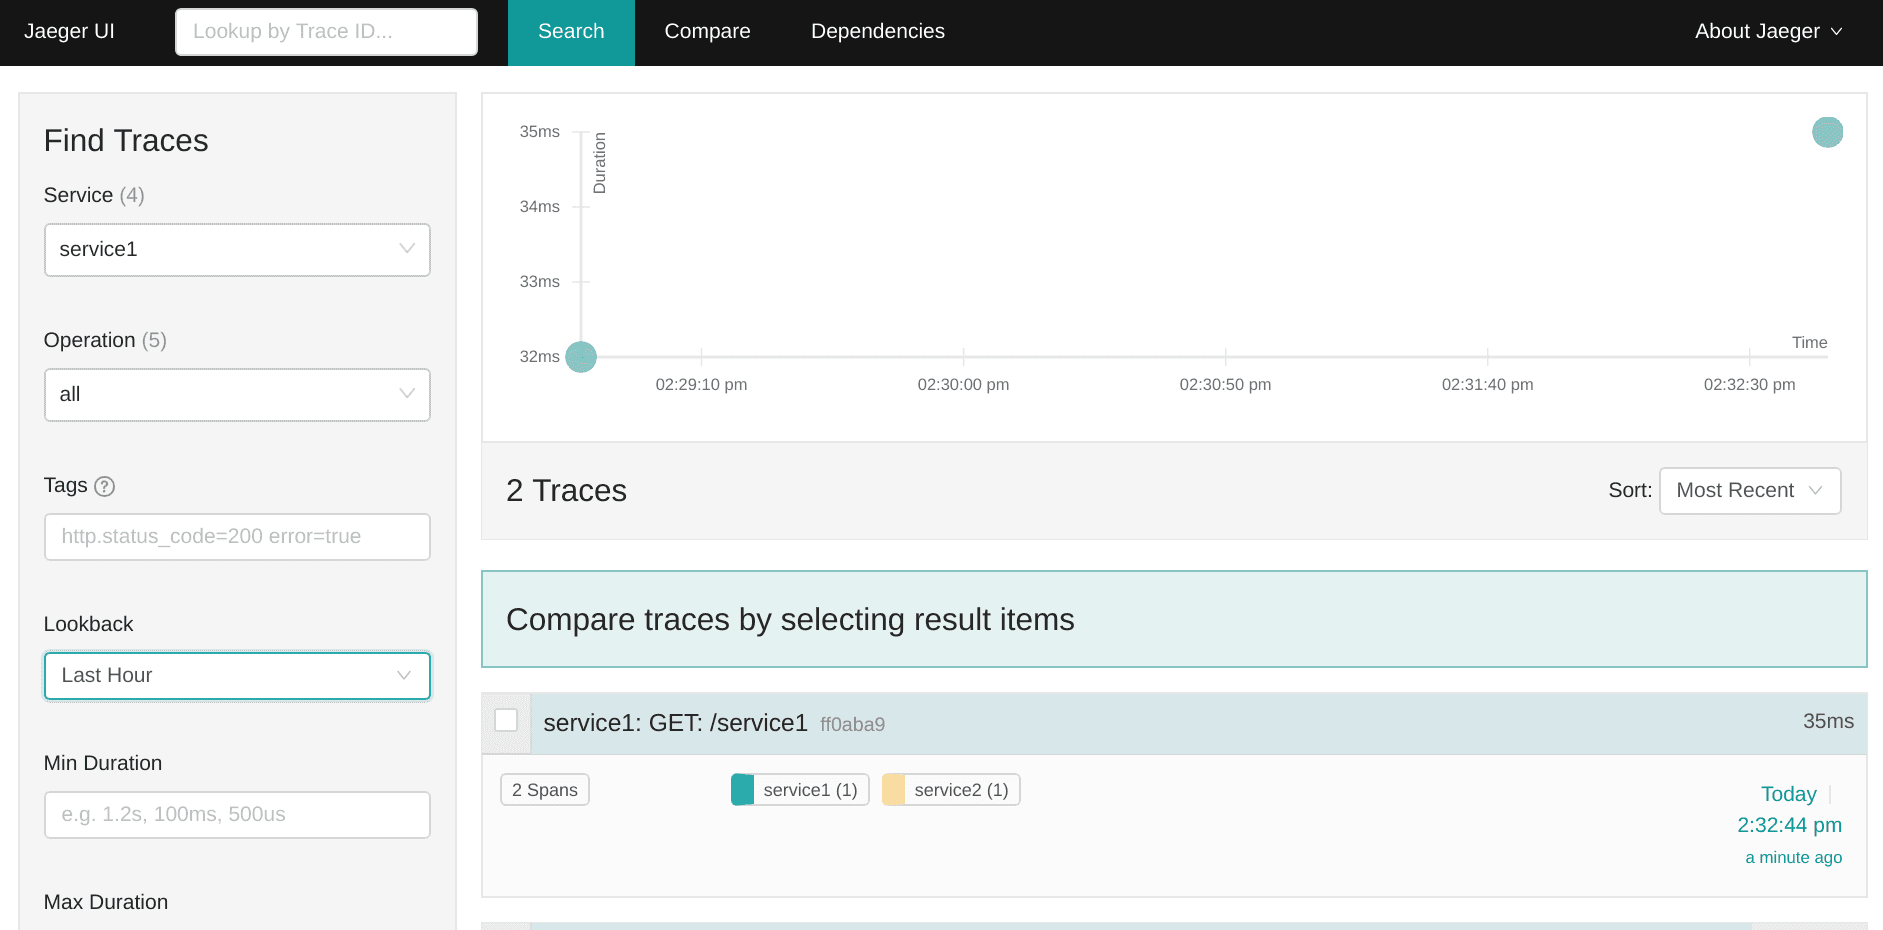
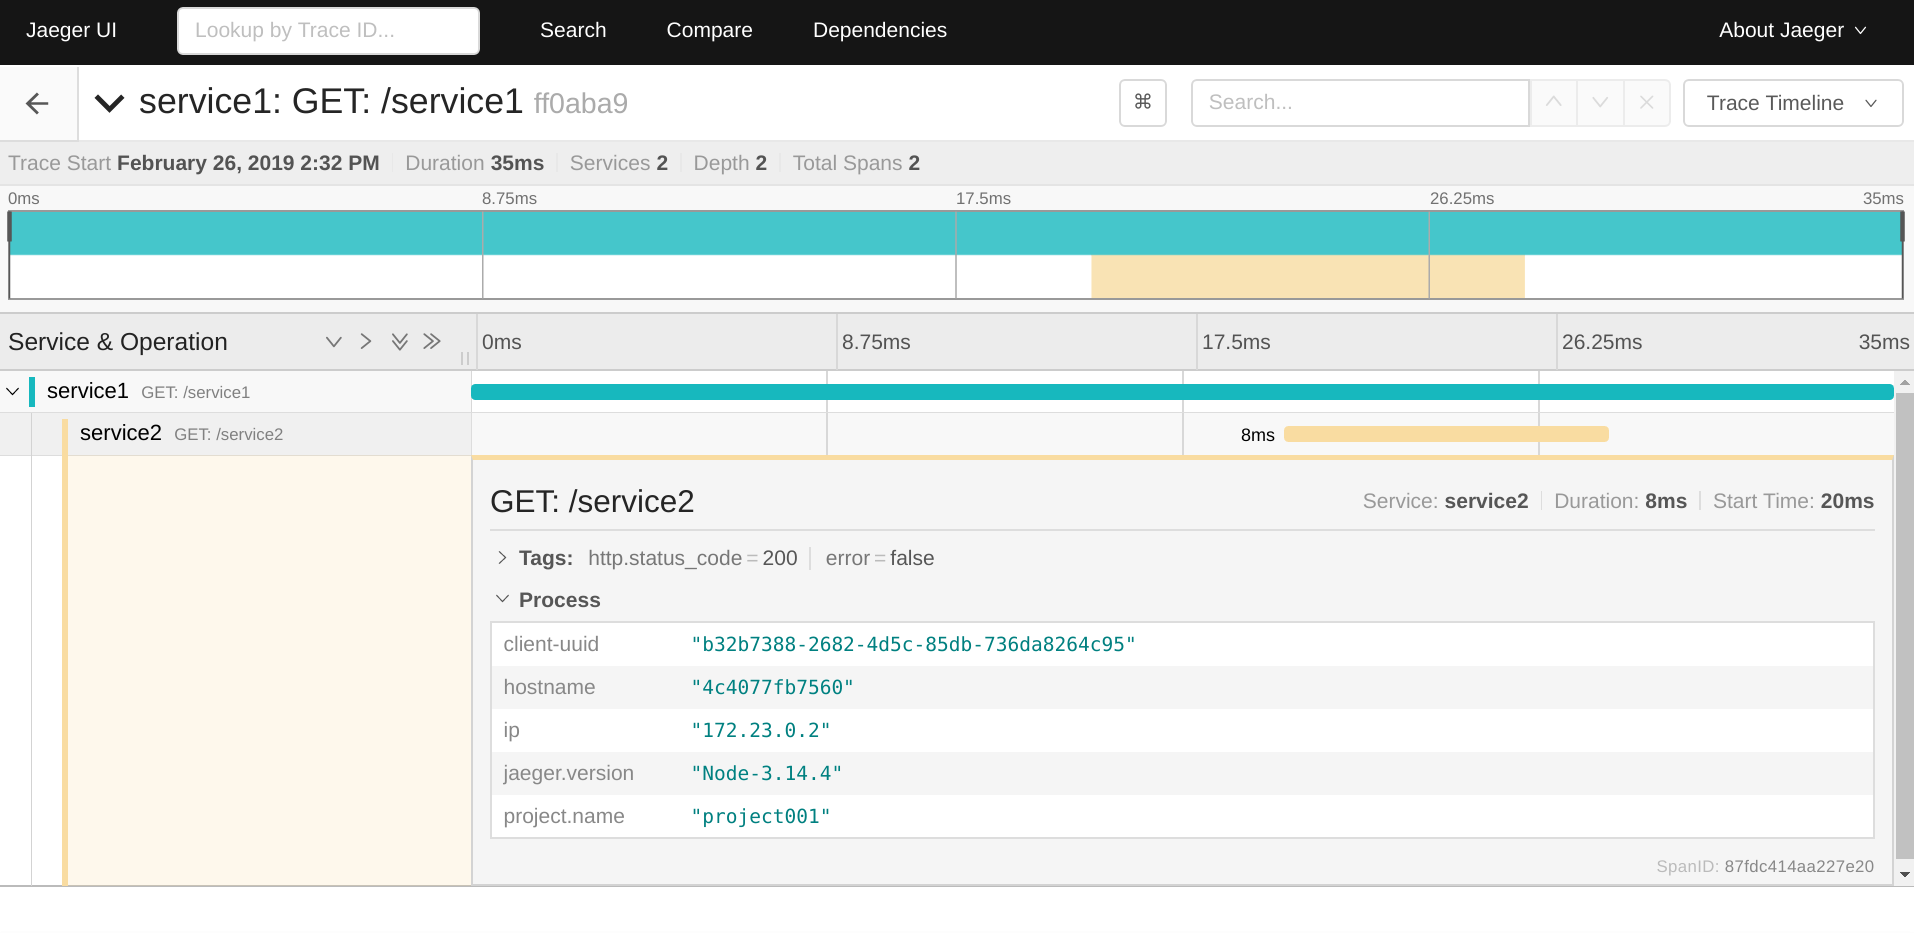
Pure awesomeness. ? We have the exact amount of ingested spans and they’re nested accordingly. This means that propagation works as expected so Jaeger can see the relationship between (root) span from the service1 and (child) span from the service2.
And this is, ladies and gentlemen, distributed tracing. My apologies if you were expecting something more... complex. The thing is that today's technologies are mostly simple to use. ?
Bring your app insights to the next level
Today we’ve found out that it’s a good idea to watch more things than just CPU usage, memory consumption and uptime. Proper observability tools should be always integral part of your technology stack since they can show useful data you can’t find anywhere else.
It turns out that non-automatically instrumented tracing tools (such as Jaeger) require certain changes in the application code which can be pretty time consuming. On the other hand, do you want to debug your application with the crystal ball or with some proper tooling which shows the whole timeline with the absolute precision?
I would go with the second choice. It seems to be a decent investment.