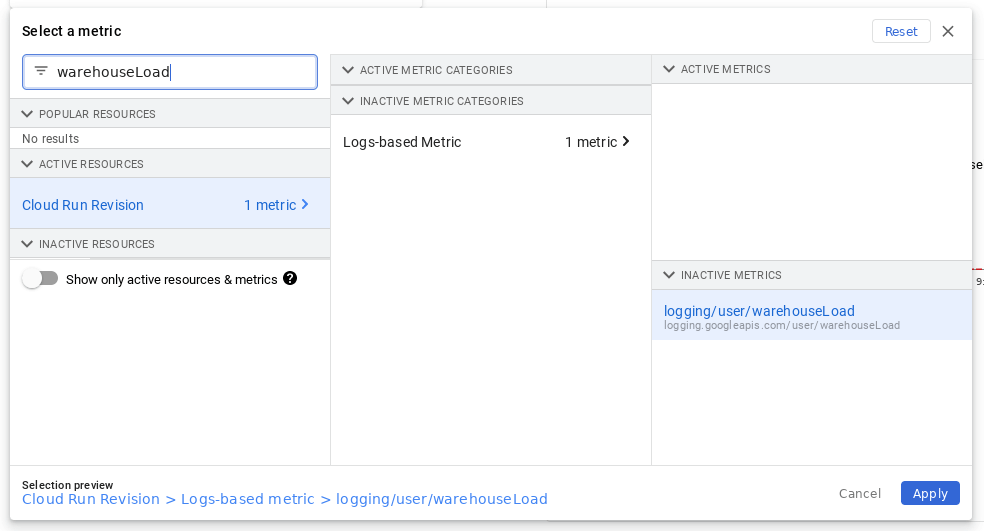
I have got a short one today. It’s mainly a small issue that might bother you. At first, I thought the GCP console was just borken again, but I guess I was just using it wrong this time. Have you ever created a log-based metric and tried to find it in Metrics Explorer? The UI is a bit misleading. It shows all the available GCP resources there are. Which one is the correct one?
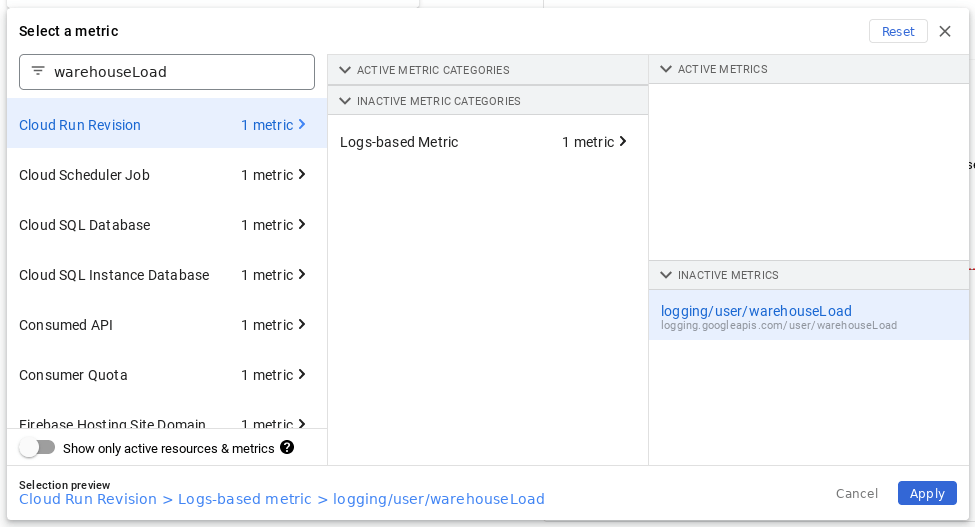
You might say, well, just switch that Show only active resources & metrics, you silly! No no, what if the data is still not there? What if you would like to create an alert that fires right after there is a single point of data? In that case, there might be a time frame with no data.
But what's wrong? Why so many resources? First, you should go back to the creation of the metric. Let’s say you have the following filter:
jsonPayload.response.statusCode>=500
severity > "warning"
Go to the first log entry displayed by the filter in Logs Explorer. Expand the JSON and check resource and type:
resource: {
  labels: {
    …
  }
  type: "cloud_run_revision"
}
And that’s basically it. The problem with UI is that it doesn’t know which resource.type will be matched. So it suggests it could be all of them. Let’s see what happens if you add the correct resource.type into the filter:
jsonPayload.response.statusCode>=500
severity > "warning"
resource.type="cloud_run_revision"
This means Google Cloud Monitoring now knows we are working just with Cloud Run and shows only one metric in the UI:
Alert policies issues
This might also be an issue if you are creating alert policies. Let’s roll back the resource.type filter and prepare the following terraform code:
resource "google_monitoring_alert_policy" "delivery_alert_policy" {
 combiner           = "OR"
 display_name       = "Load Error - warehouseLoad"
 enabled            = false
 notification_channels = []
 project            = …
 user_labels        = {}
 conditions {
     display_name = "Load Error - logging/user/warehouseLoad"

     condition_threshold {
         comparison   = "COMPARISON_GT"
         duration     = "0s"
         filter       =
"metric.type=\"logging.googleapis.com/user/warehouseLoad\""
         threshold_value = 0

         aggregations {
             alignment_period  = "3600s"
             cross_series_reducer = "REDUCE_SUM"
             group_by_fields   = []
             per_series_aligner   = "ALIGN_DELTA"
         }

         trigger {
             count   = 1
             percent = 0
         }
     }
 }
}
The filter here in the condition_threshold block has a bit of a different role. If I leave it like this and try to apply the setup, I will get the following message:
│ Error: Error creating AlertPolicy: googleapi: Error 400: Field alert_policy.conditions[0].condition_threshold.filter had an invalid value of "metric.type="logging.googleapis.com/user/warehouseLoad"": must specify a restriction on "resource.type" in the filter; see "https://cloud.google.com/monitoring/api/resources" for a list of available resource types.Makes sense, but what if I put there anything else but cloud_run_revision. Will I be allowed to do that? Let’s put there metric.type="metric" which sounds like a resource which might be it:
filter = "metric.type=\"logging.googleapis.com/user/warehouseLoad\" AND resource.type=\"metric\""And after terraform apply:
Apply complete! Resources: 1 added, 0 changed, 0 destroyed. Sounds like it’s done, but you could be unpleasantly surprised there is no data available for the alert policy filter. The type of resource can be different because the log filter can match multiple resources, but that’s hardly the case. In most cases, your resource type of alert policy filter needs to match the resource type of logs from the log explorer filter.
Correct alert policy in this example looks like the following:
resource "google_monitoring_alert_policy" "delivery_alert_policy" {
     combiner           = "OR"
     display_name       = "Load Error - warehouseLoad"
     enabled            = false
     notification_channels = []
     project            = …
     user_labels        = {}
conditions {
display_name = "Load Error - logging/user/warehouseLoad"
condition_threshold {
comparison = "COMPARISON_GT"
duration = "0s"
filter =
"metric.type=\"logging.googleapis.com/user/warehouseLoad\" AND
resource.type=\"cloud_run_revision\""
threshold_value = 0
aggregations {
alignment_period = "3600s"
cross_series_reducer = "REDUCE_SUM"
group_by_fields = []
per_series_aligner = "ALIGN_DELTA"
}
trigger {
count = 1
percent = 0
}
}
}
}And that’s all. It’s simple, yet sometimes it can get rather tricky. Especially if you do not check your logs in the first place. Hopefully, I spared you a few minutes of googling. If you have any questions or additional info, please comment and subscribe.