As developers, we know how crucial it is to have a fast and efficient workflow, especially when building and testing our projects. With many devices on the market, choosing the right one for your needs can be challenging.
A large number of performance tests that use datasets suitable for benchmarking can be found on the Internet. See XcodeBenchmark. But how do the machines perform on ordinary projects?
To unravel this mystery, we decided to run a benchmark comparison of six selected iOS projects on various devices to see which one comes out on top in terms of build time. Whether you're a developer looking for a new workstation or just curious about the latest device performance, this blog post will provide valuable insights into the build time of iOS projects on different devices. So, let's get started and see which device emerges as the Xcode build time efficiency champion.
Devices
The table below gives an overview of the devices we use in our team, including their CPU and RAM specifications. All devices had Xcode 14.2 installed, and the system version was macOS Ventura 13.1.
The results were measured on the same network, and a minimum number of processes were running on each device.
| Model | CPU | RAM |
|---|---|---|
| MacBook Air 13" 2020 (MGN93CZ/A) | M1 - 8 cores (4 performance and 4 efficiency) | 8 GB |
| MacBook Pro 13,3" 2020 (MYD82RU/A) | M1 - 8 cores (4 performance and 4 efficiency) | 8 GB |
| MacBook Pro 14" 2021 (MKGP3CZ/A) | M1 Pro - 8 cores (6 performance and 2 efficiency) | 16 GB |
| MacBook Pro 14" 2021 (Z15H002K1SL/A) | M1 Pro - 10 cores (8 performance and 2 efficiency) | 32 GB |
| MacBook Pro 14" 2021 (Z15K0009SCZ/A) | M1 Max - 10 cores (8 performance and 2 efficiency) | 64 GB |
| MacBook Air 14" 2022 (Y7HJWXD4T) | M2 - 8 cores (4 performance and 4 efficiency) | 8 GB |
Projects
For the purpose of this benchmark, we selected six varied projects with sizes ranging from small to large. The projects are labeled as Project A through Project F.
Table B provides an overview of the characteristics that affect the build time of each project such as:
- lines of code
- the number of Xcode targets
- the use of the Swift Package Manager
- the version of the Tuist tool we use
- and the use of composable architecture that is a significant dependency that also affects build time
For benchmark purposes, we divide the projects into four categories:
- miniature: Project A
- small: Project B + C
- medium: Project D + E
- large: Project F
| Feature | Proj. A | Proj. B | Proj. C | Proj. D | Proj. E | Proj. F |
|---|---|---|---|---|---|---|
| Lines of code | 710 | 9,773 | 36,422 | 48,522 | 59,321 | 136,311 |
| Xcode targets | 1 | 5 | 20 | 57 | 1 | 97 |
| SPM | No | Yes | Yes | No | Yes | No |
| Tuist version | 3.13.0 | 1.52.0 | 3.7.0 | 3.9.0 | 1.52.0 | 3.2.0 |
| The composable architecture | - | TCA | TCA | - | - | - |
| Group | Mini | Small | Small | Medium | Medium | Large |
Benchmark strategy
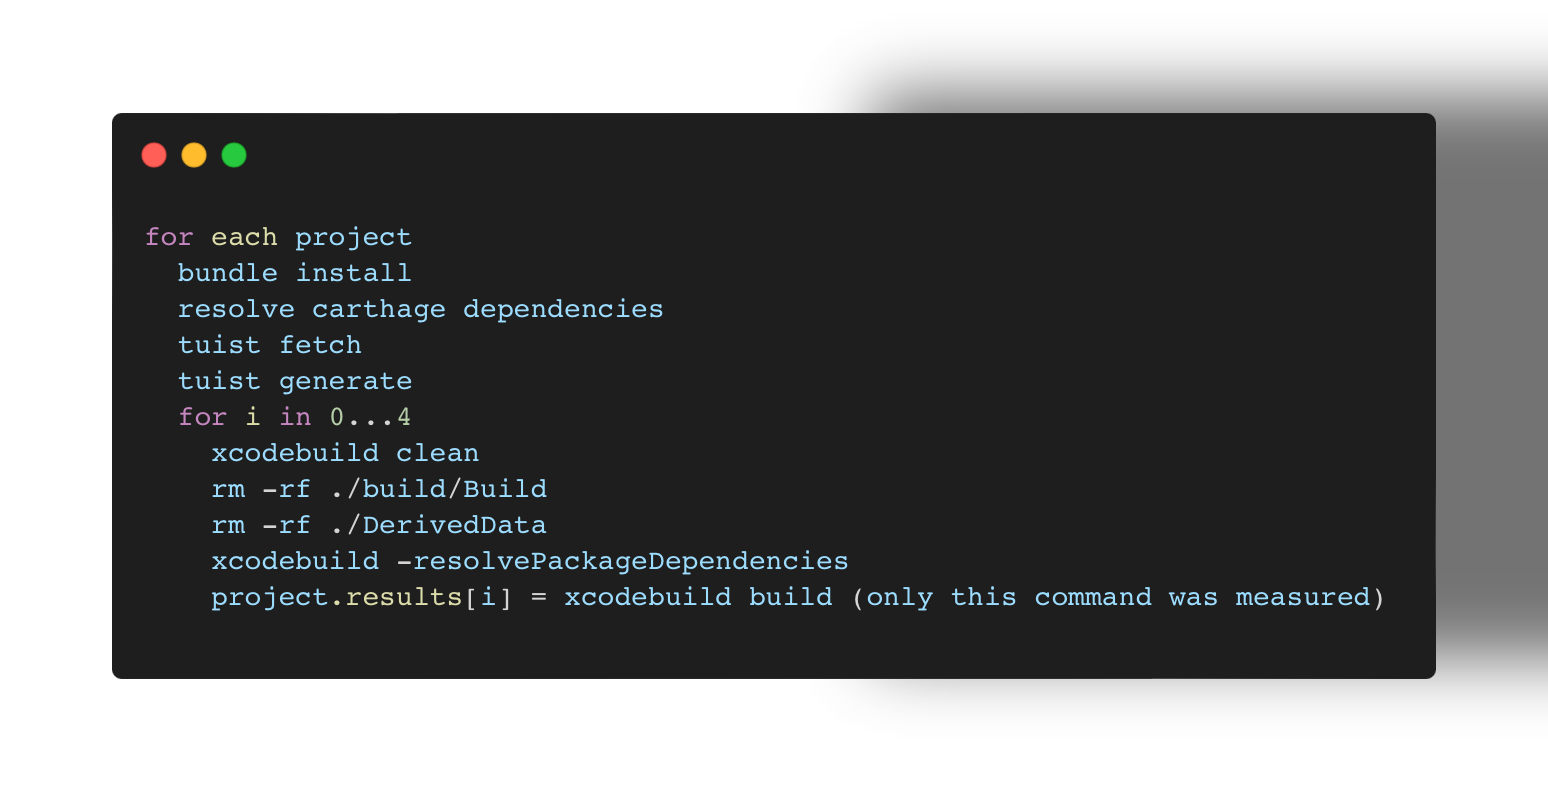
Each project was built 5 times. Before building the project, we called "clean" and "resolvePackageDependencies" build actions of the xcodebuild command. The Clean action removes build products and intermediate files from the build root. ResolvePackageDependencies action resolves any Swift package dependencies referenced by the project or workspace. We also deleted the content of folders with build cache. A simplified diagram of the benchmark algorithm is shown in …
Benchmark results
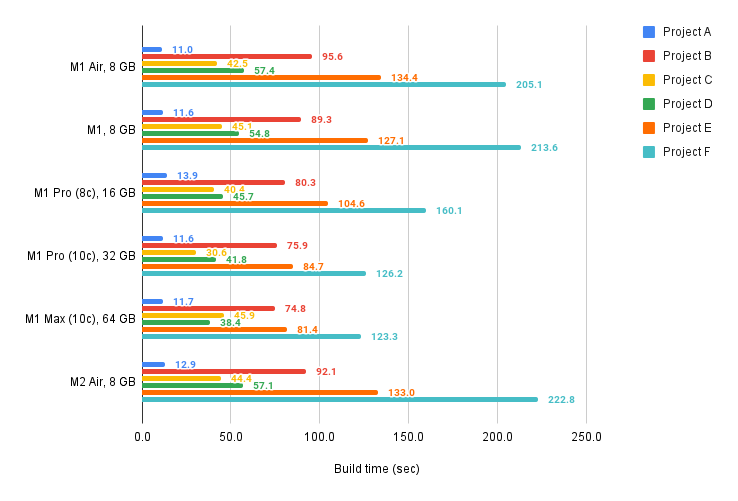
The slowest and fastest build times were discarded, and the remaining three build times were averaged to provide a representative measurement of the build time for each project. The average build time across all projects was also calculated for all devices.
| Device | Proj. A | Proj. B | Proj. C | Proj. D | Proj. E | Proj. F | Avg. time |
|---|---|---|---|---|---|---|---|
| M1 Air, 8 GB | 11.0 | 95.6 | 42.5 | 57.4 | 134.4 | 205.1 | 91.0 |
| M1, 8 GB | 11.6 | 89.3 | 45.1 | 54.8 | 127.1 | 213.6 | 90.2 |
| M1 Pro (8c), 16 GB | 13.9 | 80.3 | 40.4 | 45.7 | 104.6 | 160.1 | 74.2 |
| M1 Pro (10c), 32 GB | 11.6 | 75.9 | 30.6 | 41.8 | 84.7 | 126.2 | 61.8 |
| M1 Max (10c), 64 GB | 11.7 | 74.8 | 45.9 | 38.4 | 81.4 | 123.3 | 62.6 |
| M2 Air, 8 GB | 12.9 | 92.1 | 44.4 | 57.1 | 133.0 | 222.8 | 93.7 |
Small and Miniature
These are small projects where it is not necessarily true that better machine performance means faster build time. Results are often affected by overhead, which overrides valuable computation.
Project A is very small, and from the results, we can notice that the resulting time is not dependent on the number of cores or the size of RAM. For such a small project, not all cores are used efficiently.
The next project, Project B, is more than 13 times larger in the number of lines of code. The project is also modularized and contains a TCA dependency. Thus, it is a larger batch of work. Moreover, due to modularization, the build can be parallelized better. For this project, the difference between the times is more significant. While the M1 Air builds the project in 95.6 seconds, the M1 Max machine completes the job in about 75 seconds.
Project C was completed much faster than the previous one. This may be due to the possibility of better parallelization due to four times the number of modules. Another reason why a project with four times the number of lines of code is built faster might be that a higher version of the Tuist tool can generate a better Xcode project. But that's not the topic of this blog post.
For this project, there is little difference between the machines. Five machines out of six completed this task in between 40.39 and 45.94 seconds. It may be interesting to note that the M1 Pro machine with 10 cores and 32 GB of RAM did the best with the build of this project, which had this project built in a respectable 30 seconds.
Medium and Large projects
For the medium and large project categories, the performance of individual machines plays a significant role. Less often, unexpected results occur when comparing a pair of a less powerful machine and a more powerful machine.

Projects D and F are modularized, do not use SPM, and the Tuist tool version is 3.x.x. While Project E is monolithic, and this may limit efficient task parallelization.
If we compare these two categories with the previous ones, we can see that the results show a clear trend. The M1 Air, M1 MacBook Pro, and M2 Air all show similar results. While the M1 Pro with 8 cores performs about average, the times of the M1 Max and M1 Pro with 10 cores are almost similar.
For project D, the difference between the fastest and slowest machine is 19 seconds. This difference is insignificant considering the price difference between these machines, which is 60k CZK.
With longer build time, the differences between the machines increase. M1 Pro with 10 cores and M1 Max machines solve the D task in 83 seconds on average. Build time for each machine in the Air M1 + Air M2 + M1 Macbook Pro trio is 131 seconds on average. This means a 48-second difference between these machines.
M1 vs. M2: Verdict
The benchmark aimed to answer which MacBook model with the new Apple Silicon chip is suitable for iOS application development. To measure build time, we selected 6 iOS projects that were measured on 6 different MacBook machines. The results showed that performance across all projects does not scale linearly with the price.
On micro and small projects, the differences between the times are in the order of units of seconds. On such small projects, a MacBook Air with an M1 or M2 chip performs similarly to its more expensive counterparts.
More significant differences start to show up on medium- and large-scale projects. Here, we've seen differences in the order of tens of seconds. The M2 Air, M1 Air, and MacBook Pro M1 performed very similarly for these projects. This result is also consistent with XcodeBenchmark.
The shortest build times were observed for the M1 Pro with 10 cores and 32GB RAM and the M1 Max with 10 cores and 64GB RAM. For Project E and D, build time dropped by almost 40% compared to the M2 Air, M1 Air, and MacBook Pro M1. That means M1 Max or M1 Pro with 10 cores can build the project three times while M2 Air, M1 Air or MacBook Pro M1 can only build it 2 times.
The build time for the MacBook M1 Pro 8 cores device was about halfway between the M1 Max, M1 Pro 10 cores and the M2 Air, M1 Air or MacBook Pro M1.
| Device | Avg Build Time (sec) |
|---|---|
| M1 Air, 8 GB | 91.0 |
| M1, 8 GB | 90.2 |
| M2 Air, 8 GB | 93.7 |
| M1 Pro (8c), 16 GB | 74.2 |
| M1 Pro (10c), 32 GB | 61.8 |
| M1 Max (10c), 64 GB | 62.6 |
Most developers work on not only small or large projects over time but have to build projects of all sizes. Therefore, the telling value for the benchmark output will be the average build time across all projects tested. That is what you can see in the table above.

I plotted the average build time along with the actual price of the tested devices in Chart 3. The chart shows that if you want to buy a cheap device, I would definitely reach for a MacBook Air with the M1 Apple Silicon chip. The benchmark results showed that the upgrade between the M1 and M2 Air did not affect the build time length. I would instead invest the price difference between these devices into upgrading the RAM from 8GB to 16GB.
If you want to build projects like Top Gear's fastest drivers chopping up the Eboladrome track, it's worth reaching for a MacBook M1 Pro with 10 cores and 32GB of RAM. The MacBook M1 Max with 64GB of RAM seemed to be overkill for our projects. Moreover, there is a difference of almost 18k CZK between these devices with similar average build times.
I think the MacBook M1 Pro with 8 cores and 16GB RAM is the winner. The price-performance ratio comes out as the best for the tested projects.