
Recently our Jest integration tests crashed on insufficient memory (the V8 "heap out of memory" error). It turned out it was not an anomaly and that the tests steadily accumulated so much memory that the single Node.js process hit the default limit of 4 GB set for V8 for heap size (we explicitly run them in sequence, that’s why there is only a single process). We have about 450 tests together in 50 suites, which are mostly integration tests: simulated HTTP requests are resolved on the server which communicates with the Postgres database running in Docker. This is the reason for sequential run, since we don't have an isolated storage for each suite. After we found several issues with Jest matching our diagnoses (pick your favorite here: ts-jest#1967, jest#10550, jest#11956, jest#12142, jest#7311, jest#7874, jest#11956), one of the actions we took was to find out whether migrating to an alternative framework would solve our issues.
Let's find out together where Jest stands in memory requirements and performance against its competitors: AVA, Mocha and Tap.
Measuring methods
Memory sampling in Node.js
If you are running a single threaded Node.js app in a single process, you can sample memory in each tick of the event loop with the following snippet:
let memStats = {}; // global accumulator

process.nextTick(() => { // register function for each "tick"
 const current = process.memoryUsage(); // get memory usage info
 for (const key in current) {
   // for each key val pair store max value
   memStats[key] = Math.max(memStats[key] || 0, current[key]);
 }
});

process.on("exit", () => {
 // when the process is done, log once the maximum values
 console.log(memStats);
});
This approach becomes problematic if one of your testing subjects (looking at you AVA) cannot be forced to run in a single process and single thread. Even though you can configure the thread pool size, you cannot have a global setup for the process, but only for individual workers, making the measures skewed.
It goes without saying that this has performance impact and is not to be used in any production code.
Time util
GNU implementation of time command (usually needs to be invoked with full path, e.g. /usr/bin/time to avoid using your shell override of time) has a verbose option that gives you detailed information about not only time, but also resources used by the process.
$ /usr/bin/time -v npm run test

    User time (seconds): 4.39
    System time (seconds): 0.45
    Percent of CPU this job got: 7%
    Elapsed (wall clock) time (h:mm:ss or m:ss): 1:06.7
    Average shared text size (kbytes): 0
    Average unshared data size (kbytes): 0
    Average stack size (kbytes): 0
    Average total size (kbytes): 0
    Maximum resident set size (kbytes): 95012 # this is what we're after, same as "rss" from "process.memoryUsage()"
    Average resident set size (kbytes): 0
    Major (requiring I/O) page faults: 0
    Minor (reclaiming a frame) page faults: 60030
    Voluntary context switches: 6206
    Involuntary context switches: 499
    Swaps: 0
    File system inputs: 0
    File system outputs: 8
    Socket messages sent: 0
    Socket messages received: 0
    Signals delivered: 0
    Page size (bytes): 4096
    Exit status: 0
As long as we can limit the frameworks to a single process, time gives a uniform approach to measuring speed and memory consumption. Let's do some testing!
Results: Jest vs. Mocha vs. AVA vs. Tap
Before we go over the highlights, if you are interested in more nerdy details, see this repository. You can even clone it and run your own tests. Find more details in the readme.
Horde of tests!
The simplest to measure was a scenario with many trivial tests: 100K tests (in 1K suites). Here are the results:
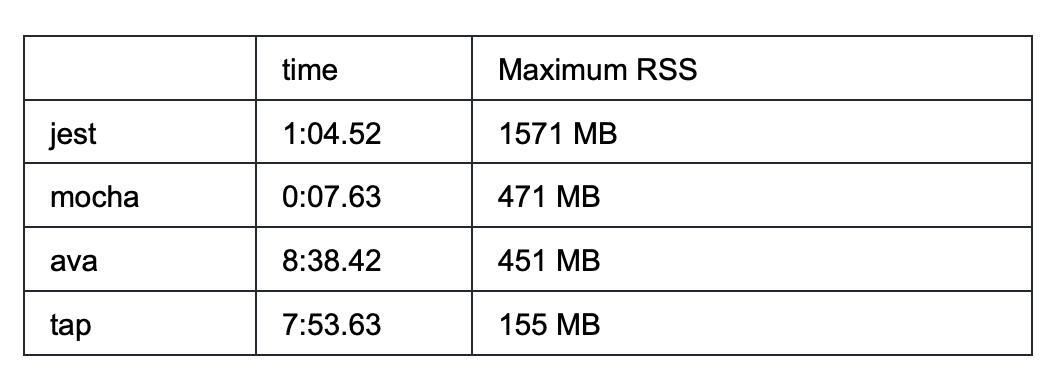
As you can see, there are a couple of takeaways for this scenario:
- Jest requires more than 3x more memory than average
- Tap and AVA are astonishingly slow
- Tap has by far the lowest memory requirements (10x less than Jest!)
- Mocha is super fast
Async tests
First test was very unfavorable to any work distribution, since there was no pending IO. It comes as no surprise that Mocha would outperform others. This time, we shall try a scenario closer to our integration tests: Imagine that each test performs a 500 ms IO operation and let's also reduce the number of tests to 100 (in 10 suites).
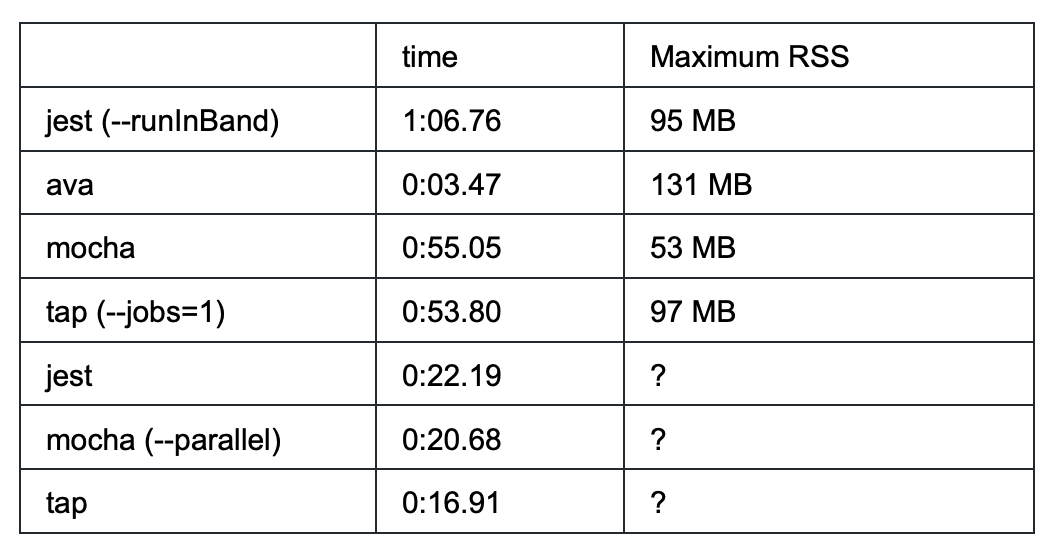
(The memory of multi process runs is challenging to measure, so the values are missing)
- AVA has the worst memory performance, but adequate to unmatched speed (individual tests run in parallel)
- Mocha still has best memory requirements and outperforms Jest slightly in both sequential and parallel runs
- Tap has a similar memory to Jest. It doesn't run tests concurrently like AVA, but manages to outperform Jest and Mocha, most probably by using the master process as a worker as well (on my 4 cores, both Jest and Mocha processed in parallel 3 + 3 + 3 + 1 suites, whereas Tap did 4 + 4 + 1, bringing the whole time down by 5s)
Leaking bucket
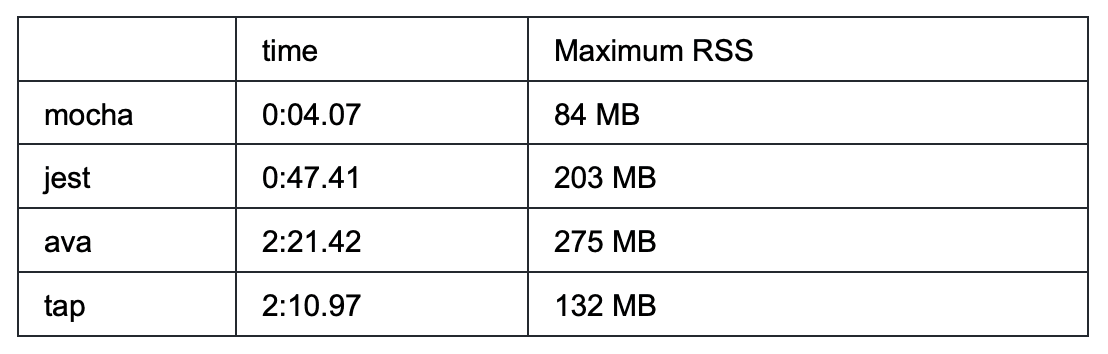
To be frank, we're not exactly doing black-box testing. We know what we're here for and we know that Jest leaks some memory in-between the suites and after inspecting the heap dumps we sort of knew what to look for: module cache. Therefore in the last test we introduced some imports. For this test (all variants), there is no wait and 1K suites, each with a single test.
Simple run:
Import standard Node modules: path, crypto, os, fs in each test and call one function of each:

Atop of that, leave a “hanging” setInterval (possibly simulating opened connection) in the suite:

In the last run, Tap's timeout was set to 1 ms, because otherwise it would not start a new suit, waiting for the current one to finish.
- Importing modules does not significantly affect memory for AVA, Tap or Mocha, while Jest more than doubles the memory.
- Mocha keeps by far the lowest memory profile and best performance
- Mocha and AVA stay stable regardless of open handles, while Jest goes crazy with memory
- Tap does handle the opened handles worse memory-wise, but not as bad as Jest
Summary: Most efficient Node testing framework
If performance is your key requirement, go with Mocha. It has in all tests the smallest memory footprint and surpasses all competitors in both serial and parallel mode.
AVA might be an interesting choice if you don’t plan to go with an extreme number of tests. Its default parallelization of tests within the suites is unique. It requires a lot of discipline to write tests without race conditions and makes integration tests over a shared resource challenging, but it might be worth your time.
Tap has poor time performance with an extremely large number of tests (same as AVA, but for AVA it is reasonable to have inferior performance due to running tests concurrently, whereas for Tap it is not obvious why it is so much worse than Jest for example). Surprisingly enough, it is the only runner that uses all available cores for test execution.
And lastly, everyone’s favorite Jest is outperformed by its competitors in almost every tested scenario in memory and usually in time as well.