
In case you ever wondered how many keys your Redis database contains and how large they are, you had to encounter a --bigkeys argument. The output of the command gives you quick information about the keys and data types used in the database. It’s very practical once your SCAN commands begin to slow down and the database is growing more than expected. But what if you would like to check the output more often, furthermore, what if you would like to create metrics out of the output.
Implementation of the output scraper
I, intuitively, first checked if there is by any chance something already out there. But after a few hours, I was rather disappointed. The output of the command does not generate any JSON which could be easily exposed somewhere for other monitoring services. Neither was I able to find any Prometheus Exporter. I’ve done my research in the middle of 2021, so, hopefully, the situation changed a bit. But in my case, I felt I had to get my hands dirty.
Let’s see the output of command redis-cli --bigkeys:
# Scanning the entire keyspace to find biggest keys as well as
# average sizes per key type.  You can use -i 0.1 to sleep 0.1 sec
# per 100 SCAN commands (not usually needed).

[00.00%] Biggest string found so far 'users:h9hy' with 187 bytes
[00.00%] Biggest string found so far 'users:YzST' with 743 bytes
[00.00%] Biggest string found so far 'users:ZlBO' with 756 bytes
[00.00%] Biggest string found so far 'user:/v1.Source' with 941 bytes
[06.90%] Biggest string found so far 'user:/v1.Article' with 1210 bytes
[13.79%] Biggest string found so far 'user:/v1.Explore' with 21044 bytes
[13.79%] Biggest string found so far 'user:/v1.Explore' with 31677 bytes
[27.59%] Biggest string found so far 'most-trending' with 33902 bytes
[33.79%] Biggest string found so far 'explore-data' with 45418 bytes
[72.41%] Biggest hash   found so far 'device-log' with 22 fields

-------- summary -------

Sampled 145 keys in the keyspace!
Total key length in bytes is 6964 (avg len 48.03)

Biggest string found 'explore-data' has 45418 bytes
Biggest   hash found 'device-log' has 22 fields

144 strings with 224554 bytes (99.31% of keys, avg size 1559.40)
0 lists with 0 items (00.00% of keys, avg size 0.00)
0 sets with 0 members (00.00% of keys, avg size 0.00)
1 hashs with 22 fields (00.69% of keys, avg size 22.00)
0 zsets with 0 members (00.00% of keys, avg size 0.00)
After a discussion with my favourite backend team, we decided that only the biggest keys and average values are important for us. For each “biggest” key we would keep labels of data type and name. The value would be the size before the name of the unit. For example:
Biggest string found 'explore-data' has 45418 bytes
Biggest   hash found 'device-log' has 22 fields
Would be kept as:

For the average, we decided to keep the data type and average size. For example:
144 strings with 224554 bytes (99.31% of keys, avg size 1559.40)
0 lists with 0 items (00.00% of keys, avg size 0.00)
0 sets with 0 members (00.00% of keys, avg size 0.00)
1 hashs with 22 fields (00.69% of keys, avg size 22.00)
0 zsets with 0 members (00.00% of keys, avg size 0.00)
Would be kept as:

Both of these outputs could be scraped by the use of awk command. I would show it to you, but it wouldn’t add any value to this post. It is rather ugly. If you are interested, check the script.
Everything is then pushed to Google Monitoring as metrics. Once you have your data in the cloud, you can use Grafana to display data in a dashboard. In our case, we also show descriptions where users can find links to log lines in Google Logging. This is very handy in case developers would like to investigate the output of the command by themselves.
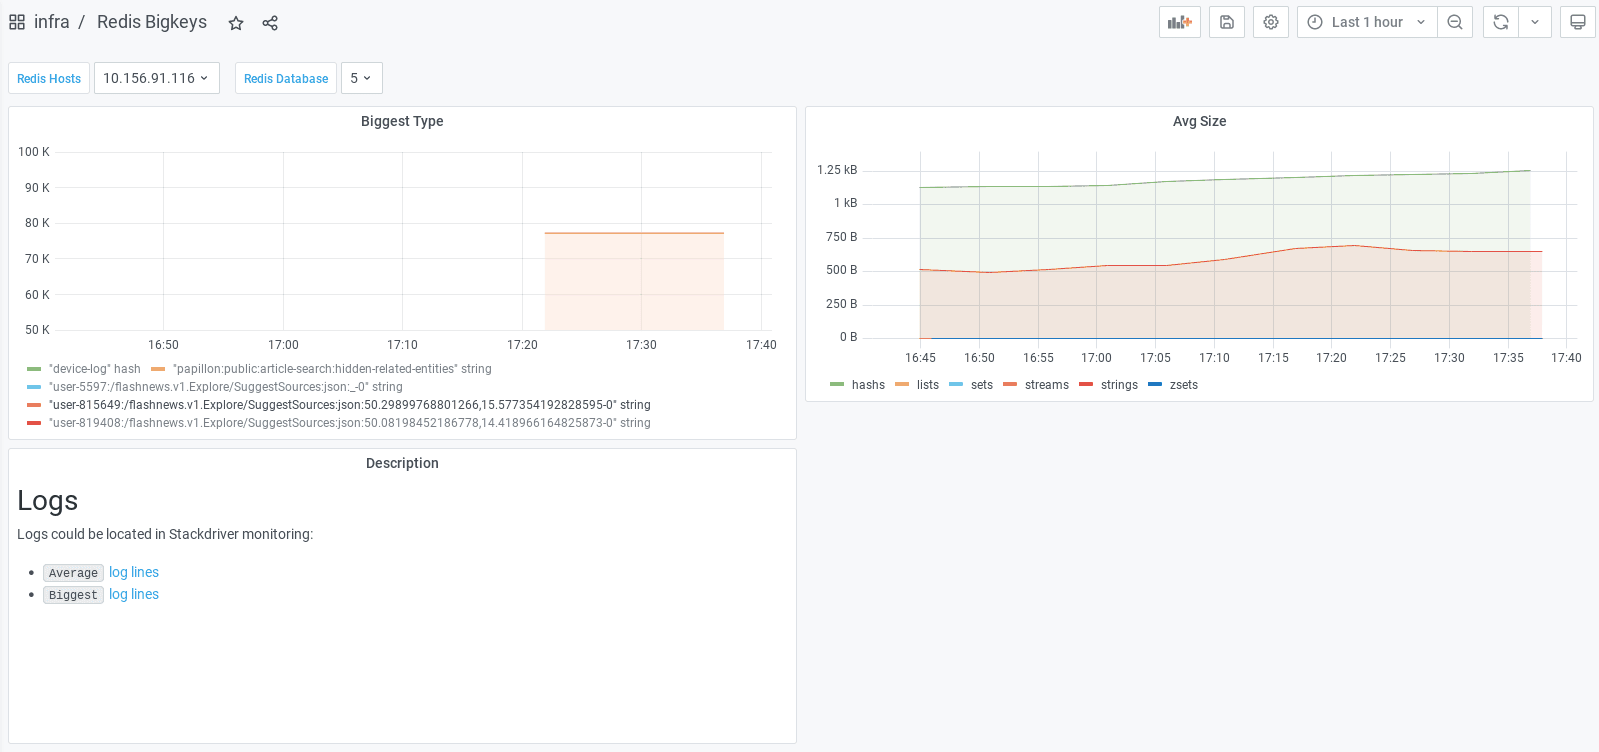
Grafana dashboard can be found in the Github repository.
Where to put it
The scraping needs to be done once in a while. That means the script has to run in a loop somewhere. We use the Grafana helm chart, therefore we already have Kubernetes running. So we provisioned Kubernetes deployment with the scraping script and let it collect the data for us.
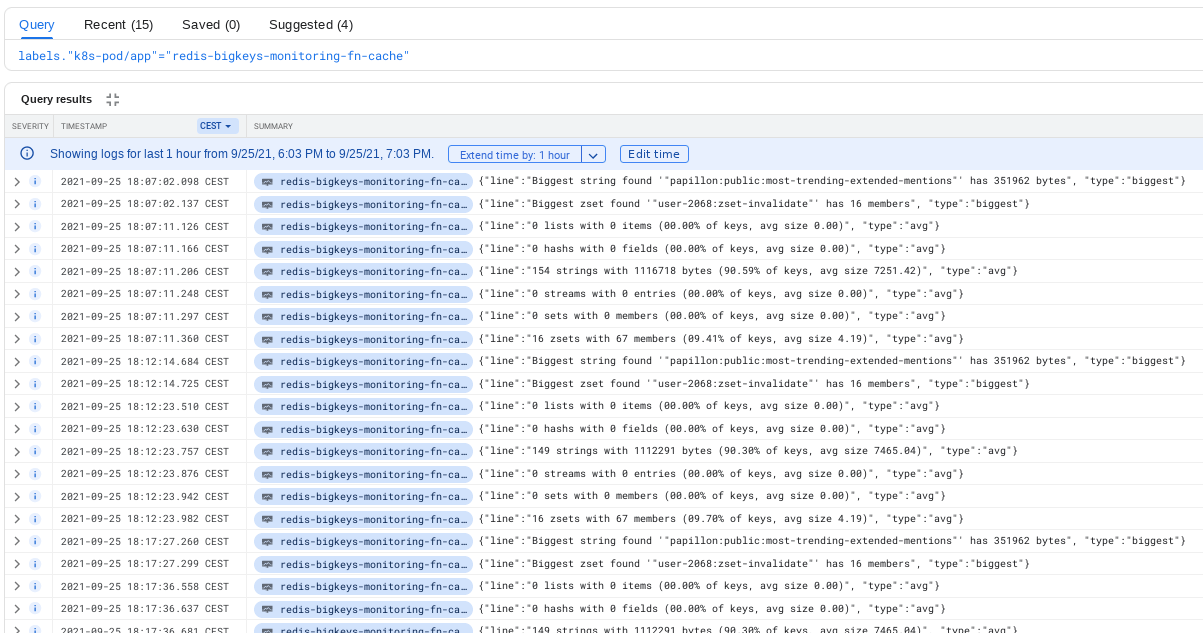
The script also displays output from parsing to the stdout. To display it correctly in Google Logging, the whole output is packed in JSON. This helps us in case we are interested in the raw output which is not visible in the metrics.
What’s next
After a few days of usage, we noticed that the CPU usage of Redis is slightly higher than usual. Also commands like INFO, DBSIZE and TYPE got used more frequently than usual. Computing statistics for --bigkeys is not as cheap as expected. Because of this, we prolonged the interval of collecting the command output from one minute to five minutes. Developers do not need the values every minute anyway.
As you noticed, the whole module is dependent on Kubernetes. That makes it unsuitable for projects running for example only on Google Cloud Run. The whole script could be rewritten to Prometheus Exporter but setting up collectors in GKE to scrape the metrics seems to be harder than submitting the metrics directly in the script. Also, there would be a possible danger for stability once the metrics would be collected too often.
If you are interested: terraform code is published as a module in terraform registry. In case you know a better way to parse the --bigkeys, let me know.