In my career as a software developer, I have come across numerous challenges that have tested my troubleshooting skills. However, solving an issue of the evergrowing memory of a Node.js application ranks at the top of the list.
Detecting the issue
The first step to solving any problem is to admit there is a problem. In case of memory leaks it might be as simple as looking into the monitoring of the application environment and observing a pattern: when the application starts, it uses X amount of memory, the memory grows over time, eventually reaching some point where the memory suddenly drops right where it began.
This means the application is holding on to more and more memory and never frees it. While this can be intended, it is more than suspicious for common web apps where the app should free the memory once the client gets their response.
The drop usually signals the restart of the application as it reaches its maximum available memory. In this case, watch for exit codes 137 or the message “JavaScript heap out of memory” specific to Node.js.
The tricky part is the time the application needs to run out of memory can be as short as a few minutes, or several days - this depends on how often the “leaking” part of the application is being used.
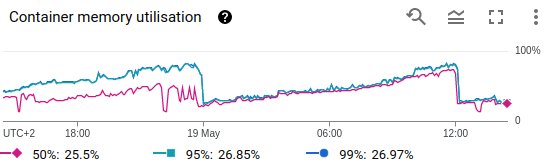 Figure 1: Google Cloud Platform Cloud Run metrics dashboard, Container memory utilization.
Localizing the source of memory leak
In my experience with modern Node.js applications, the source of memory leak is rarely code web app developers wrote. It is more likely that it is some library that you are using - in order for the libraries to be effective, they sometimes need to balance developer experience and performance, which sometimes leads to mistakes or undefined behavior.
While there are a lot of tools to detect the leak, I use them as a last resort - mostly because they are time-consuming to use, but I’ll get there. My go-to list is always:
- Check for libraries and updates
- Check your code
- Use a tool to detect memory leak
Although normally I always blame myself first, going through the changes can be time consuming than rolling back a few library updates. Especially if the leak started to happen a long time ago and you don’t know exactly which app release caused it. Therefore I suggest you take a look at the libraries you use. Focus on those with the most recent changes. Do not count on server versions to be bug-free - if it changed even slightly, it may be the change you are looking for. Focus on “magic” libraries - those you should import first thing in your code, like @google-cloud/profiler (Sorry Google, but yes, we had to stop using this lib). If it’s open source, go check for GitHub issues of the lib if there isn’t any memory leak reported already.
If you haven’t solved the problem already, go through the changes you have made. Do a thorough code review of the current revision of the code. If you know when roughly the memory problems started, you are in luck. Otherwise, well…
If options 1 and 2 failed, let’s bring out the big guns and science. I had the best experience with Chrome DevTools and I am going to demonstrate how you can use it to your advantage. The precondition is, however, you need to be able to simulate the traffic locally (there are ways to do the following to the deployed app, but that’s out of the scope of this blog).
Start off with launching the app with the --inspect flag. This allows me to connect the debugger to the app, Chrome DevTools in my case.
$ node --inspect app.jsOnce the app is running, open Chrome DevTools. You should be able to see the Node.js icon in the top left corner. Use it to open a new window, DevTools for Node.js. From there, navigate to the Memory tab.
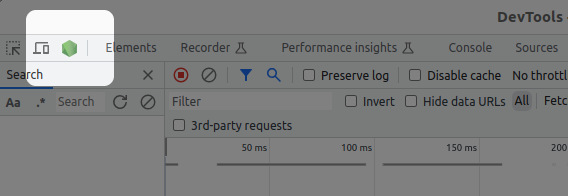
Figure 2: Chrome DevTools, Node.js.
With Heap snapshot selected, press the Take snapshot button to create a memory snapshot. I’ll want exactly two snapshots – first right after the application starts, and second after I have finished simulating traffic. Now I have everything I need, let’s take a look inside.
Remember – I want to see what has been allocated and not freed. I’ll use the Comparison view for that and focus on Size Delta which will show me how much a particular group of objects increased in size between the snapshots. This can include some objects that will be freed in the next run of Garbage Collector, but that is mostly negligible.
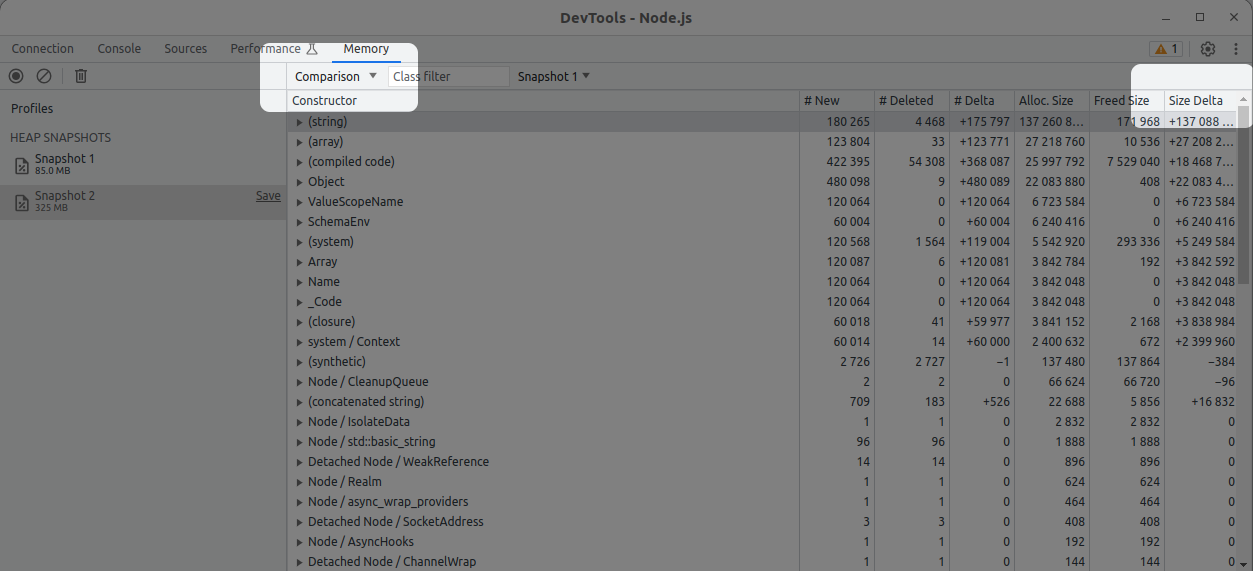 Figure 3: Comparing Node.js memory snapshots in Chrome DevTools.
Grasping the contents of the snapshot diff might not be easy, there are hundreds of thousands of objects and you can’t get through all of them. But if you keep focused on the Size Delta knowing you have leaked a noticeable amount of memory, the culprit should stand out.
In my case, several pages in the (string) Constructor I noticed weird repetitions. Inspecting the details of the record, I am able to precisely identify the part of code that is to blame (module, function, line). This is enough information for me to patch the code to prevent the leakage.
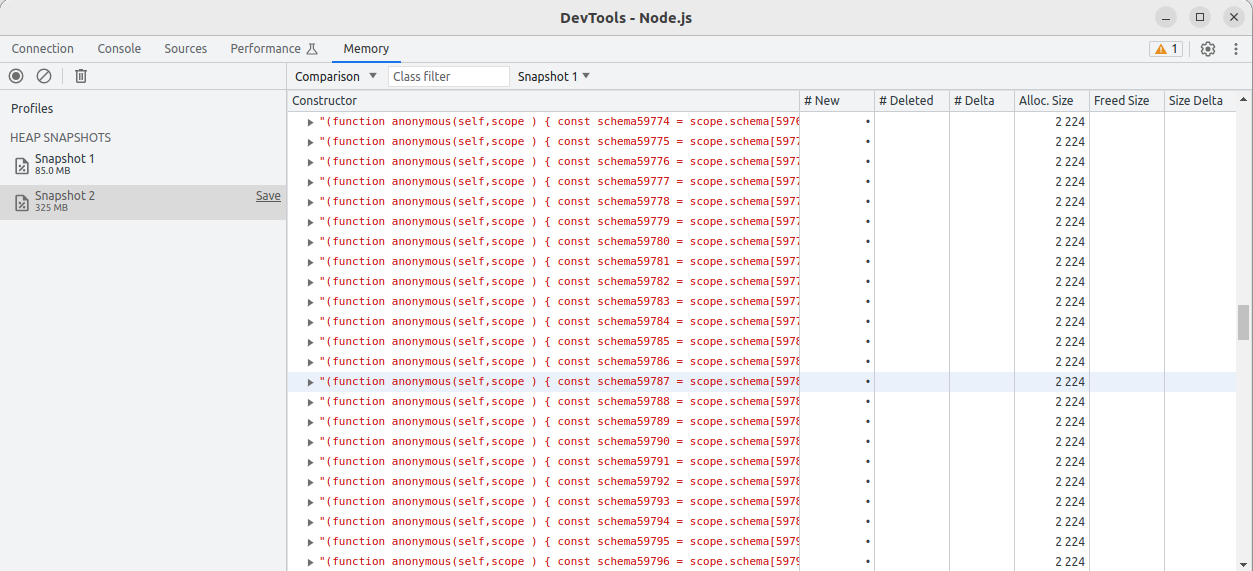 Figure 4: Repetitions in memory snapshot comparison.
Memory leaks recap
Identifying a memory leak can be a nasty problem, especially if you don’t know when it started to happen. Always start with the most probable causes, in my experience, the dependencies – but don’t forget to triple check your code too! If it’s still not enough, roll up your sleeves and dive into memory inspection, maybe you’ll be in luck and find the leak there. May you find and fix those memory leaks with ease! 🍀